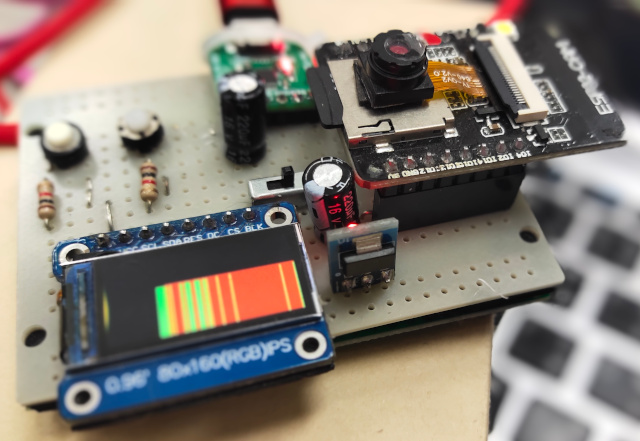
This article introduces the use of the list class in Micropython as a queue data structure with a limited number of members. It works according to the FIFO (First-In-First-Out) principle, which can be applied in a variety of applications, such as being used as a storage, and when the data is full but we need to insert new data, the old data must be pop out. The example in this article uses the dCore-miniML board (Figure 1) to read the temperature of the chip and store it in a Queue structure and display it in a bar graph and Micropython implemented firmware version 1.16 (2021-06-23) for the ESP Module (SPIRAM).
Queue structure
A queue is to store data sequentially and export data sequentially with the principle of first-come, first-served, or FIFO. The commands to control the queue consists of:
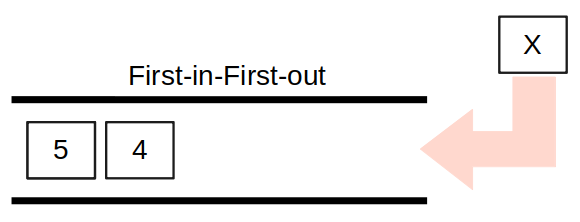
- push( x ) for importing data x to store in the queue as shown in Figure 2.
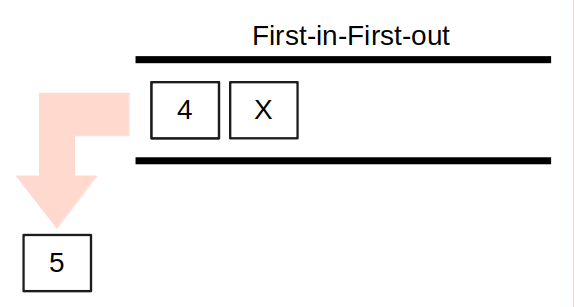
- export_value = pop() to remove the first data in the queue as shown in Figure 3.
Importing data into the queue results in two actions:
- The import is successful if the queue is not full.
- The import fails if the queue is full or there is a queue overflow.
For exporting data from a queue, there are two types of results as well:
- Successful exported.
- The export failed because the queue didn’t have any data, or it was completely removed, or the queue was empty.
From the above concepts, it can be concluded that we require the use of the list class as the data store. There must be a limit on the number of members of the list, and there must be push and pop commands that work according to the above principles. The structure of the class to be created is as follows.
class Queue:
    def __init__(self,maxN=10):
        self.idx = 0
class Queue:
    def __init__(self,maxN=10):
        self.items = []
        self.idx = 0
        self.topOfQ = maxN
    def push(self,x):
        pass
    def pop(self):
        return 0
The generated class has created an idx variable for holding the number of members in the queue and a topOfQ variable for holding the maximum number of members the queue can support. It also creates a list object named items to store data imported with push() and removed with pop().
Queuing data
The algorithm for importing x data into a queue structure by storing it in a list object with append() is as follows:
- If idx equals topOfQ, it means the queue is full, warn Queue Overflow.
- If not
- Add data to the queue
- Increase idx value
So the code for the push(x) method or function is as follows.
    def push(self,x):
        if self.idx == self.topOfQ:
            print("Queue Overflow!")
            return
        self.items.append(x)
        self.idx += 1
When testing the program according to the following code by creating a queue size of 5 members but inserting data 0,1,2,3,4,5,6 which exceeds the limit, we will find that in the queue there are only 0,1,2,3 and 4 and notify 2 times because the queue is full as shown in Figure 4.
class Queue:
    def __init__(self,maxN=10):
        self.items = []
        self.idx = 0
        self.topOfQ = maxN
    def push(self,x):
        if self.idx == self.topOfQ:
            print("Queue Overflow!")
            return
        self.items.append(x)
        self.idx += 1
    def pop(self):
        return 0
myQueue = Queue(5)

for i in range(7):
    myQueue.push(i)
    print(myQueue.items)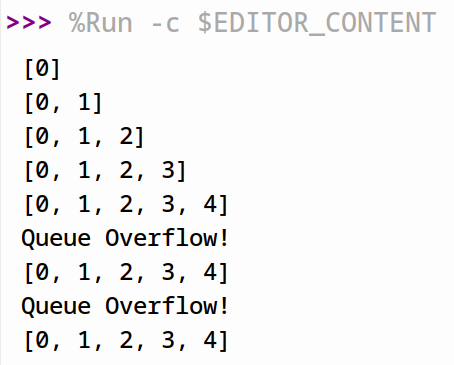
Removing data from the queue
The working principle of removing data from the queue is to remove the first member first as follows:
- If the queue member is 0, notify that the queue is empty and exit.
- If not
- Reverse the data in the list.
- Remove the removed data with pop()
- Reverse the data in the list again.
- Return the value read in step 2.
So the code for the pop method can be written as below. It is found to be very slow with a large number of members as the list has to be returned twice for the class’s pop() command to work properly. This is because the pop() of list class removes the last item. This is the working principle of a stacked data structure.
def pop(self):
if self.idx == 0:
print("Queue empty!")
return None
self.idx -= 1
self.items.reverse()
x = self.items.pop()
self.items.reverse()
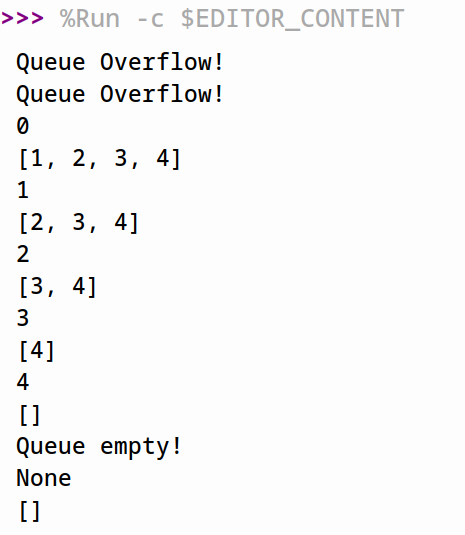
return xAn example program that tests both push() and pop() functions is as follows. An example of the operation is shown in Figure 5.
class Queue:
    def __init__(self,maxN=10):
        self.items = []
        self.idx = 0
        self.topOfQ = maxN
    def push(self,x):
        if self.idx == self.topOfQ:
            print("Queue Overflow!")
            return
        self.items.append(x)
        self.idx += 1
    def pop(self):
        if self.idx == 0:
            print("Queue empty!")
            return None
        self.idx -= 1
        self.items.reverse()
        x = self.items.pop()
        self.items.reverse()
        return x
myQueue = Queue(5)

for i in range(7):
    myQueue.push(i)
for i in range(6):
    print(myQueue.pop())
    print(myQueue.items)
Usage example
The following example program is to read the temperature value of esp32 and store it in the queue and bring the data from the queue to display it as a bar graph as shown in Figure 1 by contacting st7735, you can read the previous article.
# demo-jQueue.py
from jQueue import Queue
from st7735 import TFT
from sysfont import sysfont
from machine import SPI,Pin
import machine as mc
import time
import math
import esp32

mc.freq(240000000)
spi = SPI(2, baudrate=27000000,
          sck=Pin(14), mosi=Pin(12),
          polarity=0, phase=0)
# dc, rst, cs
tft=TFT(spi,15,13,2)
tft.init_7735(tft.GREENTAB80x160)
tft.fill(TFT.BLACK)
dataQ = Queue(160)
for i in range(160):
    dataQ.push(0)
while True:
    tft.fill(TFT.BLACK)
    # input
    tf = esp32.raw_temperature()
    tc = int((tf-32.0)/1.8)
    # process
    dataQ.pop()
    dataQ.push(tc)
    # show
    for i in range(160):
        value = dataQ.items[i]
        if value >= 49:
            tft.vline((i,80-value), value, TFT.RED)
        else:
            tft.vline((i,80-value), value, TFT.GREEN)
    time.sleep_ms(1000)
In addition, the queue structure classes have been separated into another file as follows:
class Queue:
    def __init__(self,maxN=10):
        self.items = []
        self.idx = 0
        self.topOfQ = maxN
    def push(self,x):
        if self.idx == self.topOfQ:
            print("Queue Overflow!")
            return False
        self.items.append(x)
        self.idx += 1
        return True
    def pop(self):
        if self.idx == 0:
            print("Queue empty!")
            return None
        self.idx -= 1
        self.items.reverse()
        x = self.items.pop()
        self.items.reverse()
        return x
In the example above, it can be seen that the zoning of the green and red graph is caused by setting 49 as the decision criterion. If you want to change everything, adjust the values according to the nature of the data such as Applying criteria with the average of the values contained in the queue can change the code as follows:
    minVal = 100
    maxVal = 0
    avgVal = int(math.fabs(maxVal+minVal)/2)
    tft.fill(TFT.BLACK)
    for i in range(1,160):
        value = dataQ.items[i]
        if minVal > value:
            minVal = value
            avgVal = int(math.fabs(maxVal+minVal)/2)
        if maxVal < value:
            maxVal = value
            avgVal = int(math.fabs(maxVal+minVal)/2)
        if value > avgVal:
            tft.vline((i,80-value), value, TFT.RED)
        else:
            tft.vline((i,80-value), value, TFT.GREEN)
Conclusion
From this article, the reader is familiar with the queue data structure, how to write a program to work on the principle of queue data structures and programming examples to apply to the CPU temperature graph display. In addition, we will find that when there is a lot of data, we can take the split data or take any action on the data to cause the display to change. For example, in the example, when changing the decision-making value from the imaginary constant to the actual mean, the result of the graph is more of red or green.
Finally, have fun with programming.
If you want to talk with us, feel free to leave comments below!!
(C) 2020-2021, By Jarut Busarathid and Danai Jedsadathitikul
Updated 2021-11-25