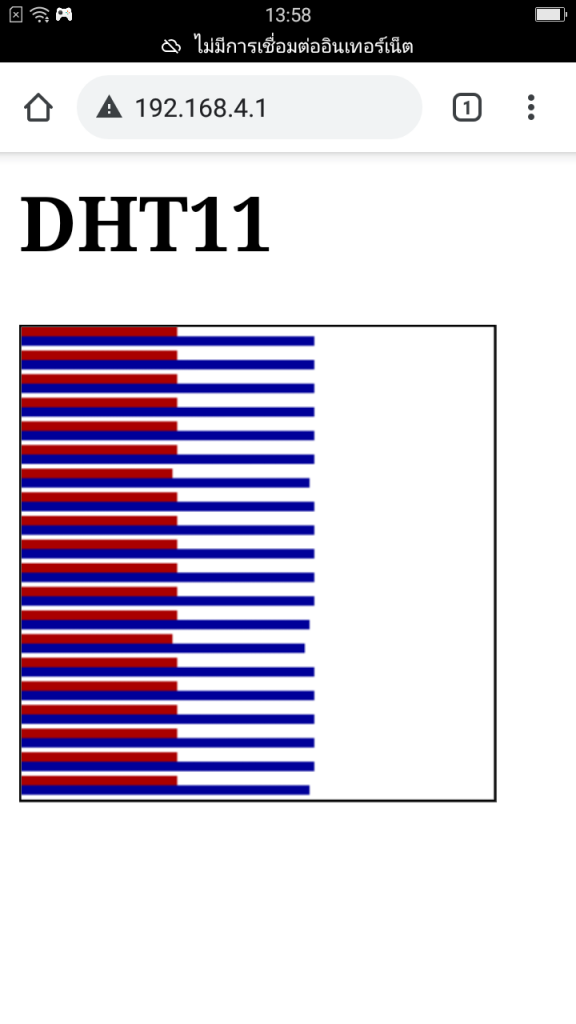
This article is an application of Python programming for Micropython used with esp8266 or esp32 attached to DHT11 for temperature and humidity storage. The last 10 temperature results collected every 5 seconds are reported as shown in Figure 1.
From the need to display the temperature through a web page that is designated as an AP named JarutEx, showing 20 historical data, allowing the microcontroller to collect temperature and humidity data from the DHT11 sensor, which needs to be written in Python on the esp8266 or esp32 board. You can read the relevant details from the following articles.
Equipment
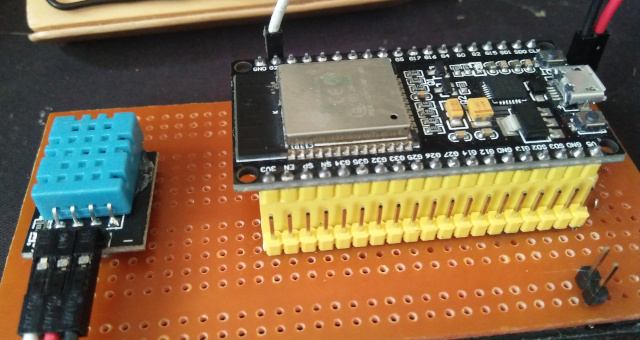
The equipment for the experiment in this article consists of 2 things as follows. When connected as shown in Figure 2, we use esp32 and connect DHT11 to pin GPIO23.
- esp8266 or esp32
- DHT11 or DHT22
Program
The program consists of the following parts:
- Preparation
- Configure the AP name and password.
- Create a queue object to use as a data placeholder.
- The getDHT11 subprogram is a timer callback function and serves to read temperature and humidity to store in the items of the queue
- The main function consists of
- Start DHT
- Create a timer and set it to run every 5 seconds in a PERIODIC manner, calling the getDHT11 function every time.
- Configure the wireless network mode as AP by specifying the name and password as specified in SSID and password.
- Wait for the system to start.
- Prepare a socket with port 80 and wait for a client to connect with the maximum number of concurrent connections set to 5 nodes.
- When a connection is made (in a while True loop), HTML+JavaScript is returned.
#
# dht11stat.py
# 2021, JarutEx
# https://www.jarutex.com
#
import network as nw
from machine import Pin
import dht
import time
from machine import Timer
from jQueue import Queue
import socket

#set up
maxData = const(20)
dht11PinNo = const(23)
ssid = 'JarutEx-AP'
password = '123456789'
storage = Queue(maxData)
for i in range(maxData):
    storage.push([0,0])

def getDHT11(x):
    dht11.measure()
    tem = dht11.temperature()
    hum = dht11.humidity()
    #print("{}. T: {}C H: {}%".format(i, tem,hum))
    storage.pop()
    storage.push([tem,hum])

if __name__=='__main__':
    dht11 = dht.DHT11(Pin(dht11PinNo))
    dht11Timer = Timer( 0 )
    dht11Timer.init( period=5000, mode=Timer.PERIODIC, callback=getDHT11 )
    ap = nw.WLAN(nw.AP_IF)
    ap.active(True)
    ap.config(essid=ssid, password=password)
    while ap.active() == False:
        pass
    print("AP configuration\n{}".format(ap.ifconfig()))
    s = socket.socket(socket.AF_INET, socket.SOCK_STREAM)
    s.bind(('', 80))
    s.listen(5)
    while True:
        conn, addr = s.accept()
        print('conn {} from {}'.format(conn, addr))
        request = conn.recv(1024)
        print('request = {}'.format(request))
        conn.send('HTTP/1.1 200 OK\n')
        conn.send('Content-Type: text/html\n')
        conn.send('Connection: close\n\n')
        conn.send("""<html><head><meta name="viewport"
          content="width=device-width, initial-scale=1">
          <meta charset="utf-8">
          </head>
          <body><div><h1>DHT11</h1>
            <canvas id="myCanvas" width="200" height="200" style="border:1px solid #000000;"></canvas>
            </div>
            <script>
                var canvas = document.getElementById("myCanvas");
                var ctx = canvas.getContext("2d");
            """)
        for i in range(maxData):
            conn.send("""
                ctx.fillStyle = "#AA0000";
                ctx.fillRect(0,
                """)
            conn.send(str(i*10))
            conn.send(",")
            conn.send(str(storage.items[i][0]*2))
            conn.send(",4);")
            conn.send("""
                ctx.fillStyle = "#000099";
                ctx.fillRect(0,
                """)
            conn.send(str(i*10+4))
            conn.send(",")
            conn.send(str(storage.items[i][1]*2))
            conn.send(",4);")
        conn.send("</script></body></html>")
        conn.close()
Conclusion
As an example in this article, programming can make a small device more versatile and present more information than just reading temperature and humidity. If taking all the data together with the use of ulab to calculate with mathematical functions to find significance or convert it to other values, makes the data more versatile. Coupled with writing JavaScript to draw on Canvas, you can create a variety of graphs. Or add text to better describe the graph. Finally, have fun with programming.
If you want to talk with us, feel free to leave comments below!!
(C) 2020-2021, By Jarut Busarathid and Danai Jedsadathitikul
Updated 2021-11-26