This article is an implementation of Python’s Pandas library using the Raspberry Pi 3 B+ board. It can be applied to Python of Windows, macOS or Linux operating systems. The article will be divided into several episodes like the previous ulab library. The article EP 1 discusses Pandas features, installation and data structure of Pandas.

Pandas
Pandas has been in development since 2008 [1] as a BSD license. It is a tool for working with data structures and data analysis. This makes it popular for applications related to finance, economics, statistics and data analysis, etc. Pandas’ vision is to be accessible to all, free to use and customize, flexible, powerful, easy to use and fast. The pros of the library are as follows.
- Fast DataFrame for data manipulation and access by indexing.
- There is a tool to read and write data in memory with external data such as CSV, Text File,Microsoft Excel File, SQL File and HDF5 file format.
- There is a Data Alignment system and a Missing Data handler.
- Flexibility to reshape and pivot of data sets
- Can perform data slicing, fancy indexing and subsetting on large data.
- Columns can be added and deleted according to the data structure used.
- Support grouping and transforming data.
- High efficiency to join and merge large data.
- Use Hierarchical axis indexing makes it possible to work with multidimensional data.
- There is a function to work on the time series including:
- date range generation และ frequency conversion
- Statistical window migration
- Date shift
- Create time domains as needed.
- Concatenate time series without losing data.
- Performance tweaks to run through Cython.
Install Pandas
Installing Pandas can be done via pip with the following command.
pip3 install pandas
For upgrading use the following format command.
pip3 install –upgrade pandas
Note
In case of new versions of Windows or Linux operating systems that have uninstalled python libraries and tools version 2 (e.g. Ubuntu 20.04) use pip instead of pip3.
Data structure
There are three types of Pandas data structures.
- It is a 1D array data structure with a single axis which is axis 0.
- It is a 2D array with two data axis: axis 0 or row and 1 or column. Each column must be of the same data type.
- It is a 3D array data structure with 3 axis: axis 0, 1 and 2 for reference to row, column and depth. It is a combination of data in multiple dataframes such as having a dataframe of sales each month, when used as a Panel, there is a DataFrame of Jan to Dec stacked in a depth axis.
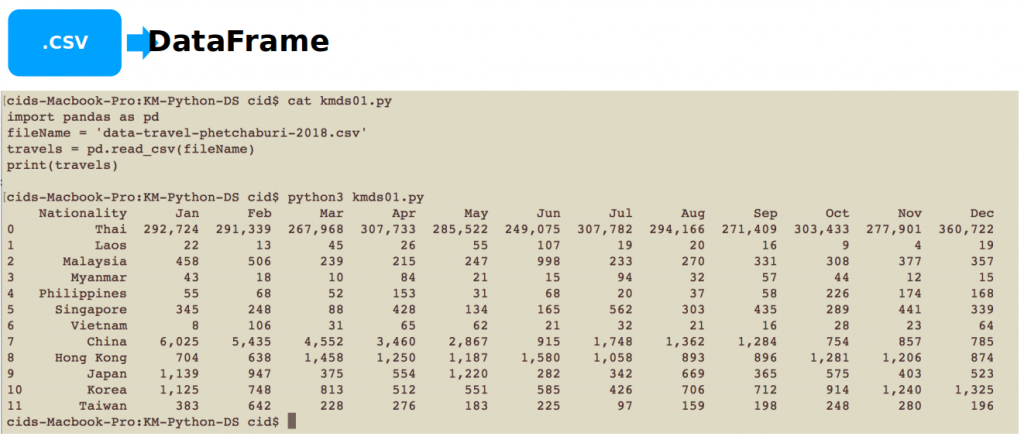
Example of loading CSV into DataFrame
The following example code loads a csv file named data-travel-phetchaburi-2018.csv. The example of the file is as shown in Figure 1.
import pandas as pd
fileName = 'data-travel-phetchaburi-2018.csv'
travels = pd.read_csv(fileName)
print(travels)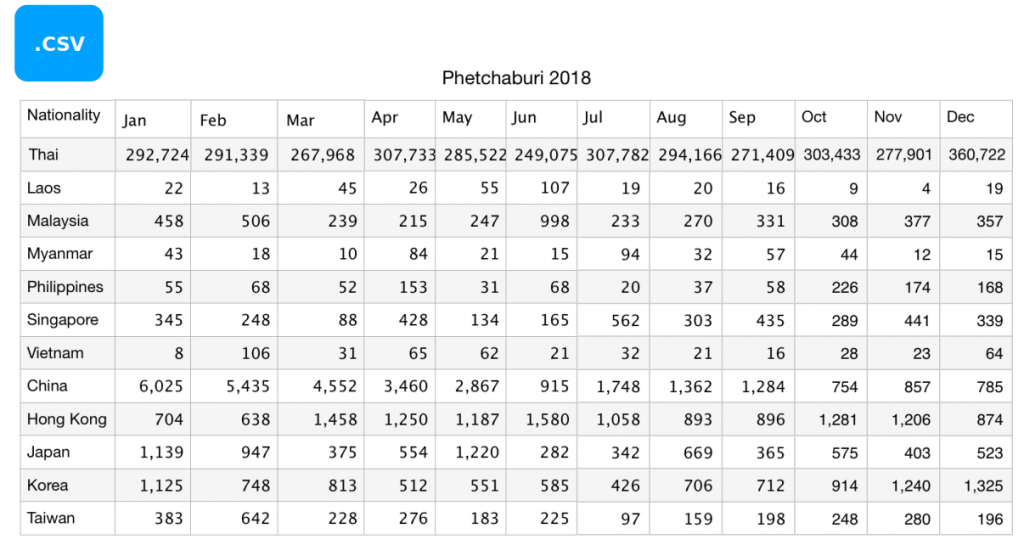
When running the program kmds01.py, the result is as shown in Figure 2.
describing
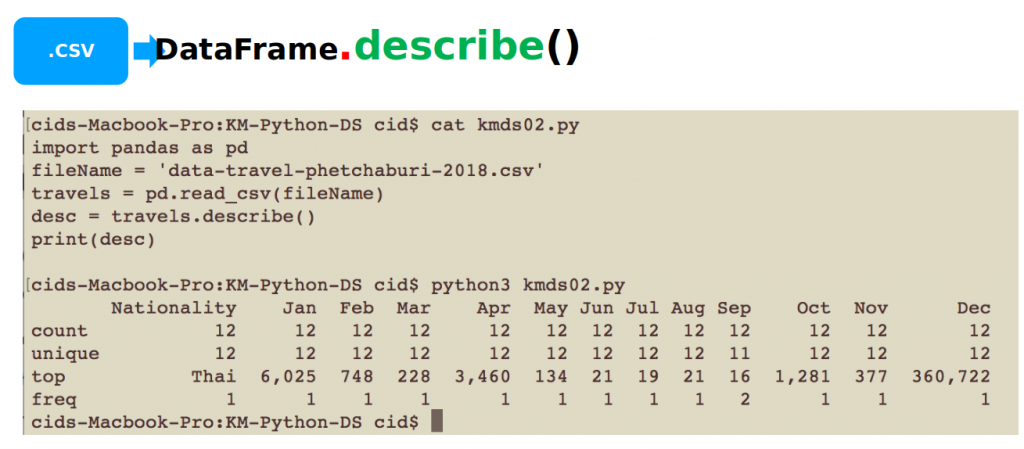
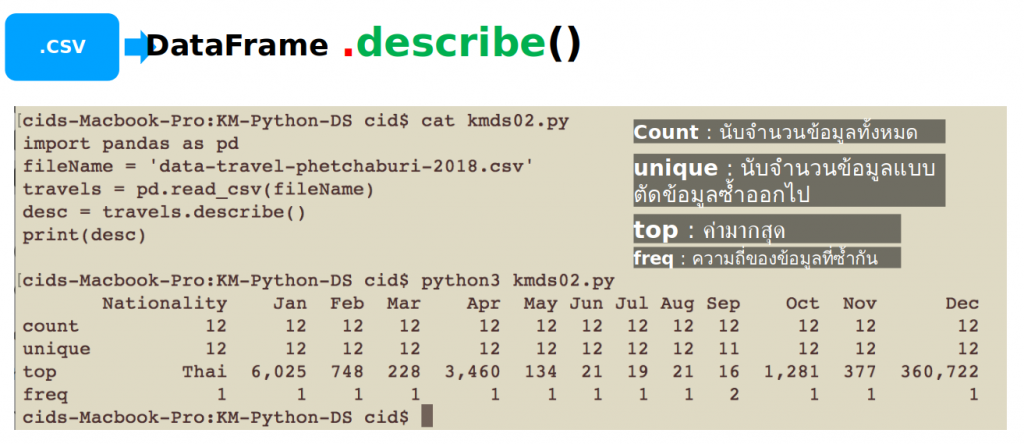
To describe data within a DataFrame, you can call the describe() method as in the example code kmds02.py.
import pandas as pd
fileName = 'data-travel-phetchaburi-2018.csv'
travels = pd.read_csv(fileName)
desc = travels.describe()
print(desc)
An example of the output of kmds02.py is shown in Figures 3 and 4, which evaluates count, unique, top and freq.
info/shape/head/tail/sample example and logging
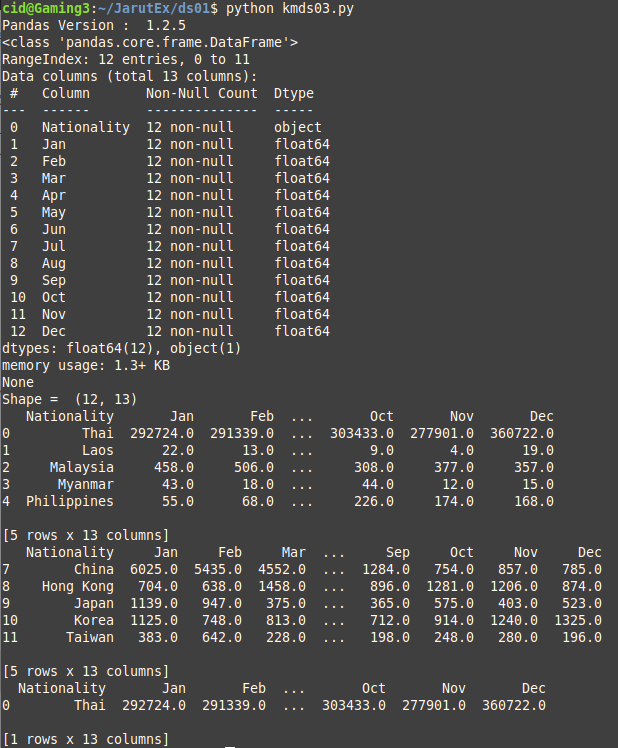
Example code kmds03.py loads data from csv, then shows pandas version, shows info of DataFrame, shows table size (shape), shows header, tail, snippet, and save DataFrame to csv and json files.
import pandas as pd
fileName = 'data-travel-phetchaburi-2018.csv'
travels = pd.read_csv(fileName)
print("Pandas Version : ", pd.__version__)
print(travels.info())
print('Shape = ',travels.shape)
print(travels.head())
print(travels.tail())
print(travels.sample())
travels.to_csv('data-travel-result.csv')
travels.to_json('data-travel-result.json')
An example of running kmds03.py is shown in Figure 5.
Example of sum/min/max/mean
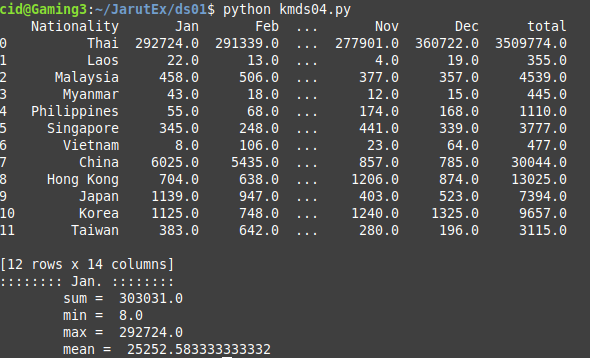
Example code kmds04.py is to process data in DataFrame to find sum, minimum, maximum and mean by selecting to process only Jan.
import pandas as pd
fileName = 'data-travel-phetchaburi-2018.csv'
travels = pd.read_csv(fileName)
travels['total'] = travels.sum(axis=1)
print(travels)
Jan = travels['Jan']
print(":::::::: Jan. ::::::::")
print('\tsum = ',Jan.sum())
print('\tmin = ',Jan.min())
print('\tmax = ',Jan.max())
print('\tmean = ',Jan.mean())
An example result from kmds04.py is shown in Figure 6.
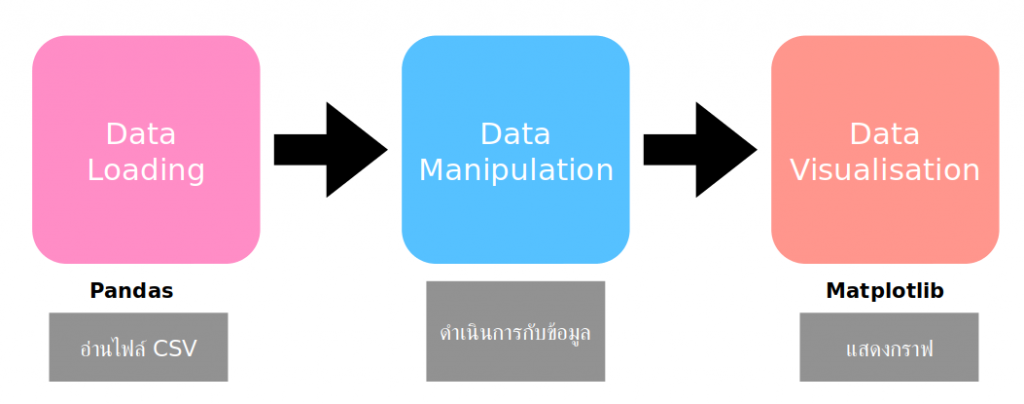
After obtaining the data and processing the data, there are many methods that will be discussed in the next article. Now, it can be concluded that Data Science has 3 basic steps as shown in Figure 7: importing data through Pandas then processes with the data and finally, display the data in a graph via Matplotlib.
From the sample reading the data to store in the DataFrame, then describe() and process the data for some time. What interesting things did readers find from the information?
Conclusion
This article describes the features and installation of Pandas, the most used library in AI, and discusses Pandas storage structures which are Series, DataFrame, and Panel starting with reading the data from the CSV file related to tourism statistics in Phetchaburi in 2018 when used via describe() method to get a more interesting summary of count, unique, top and freq. In the next episode of the article, the related subjects will be discussed. Finally, we hope this article is more or less helpful and have fun with programming.
References
(C) 2020-2021, By Jarut Busarathid and Danai Jedsadathitikul
Updated 2021-09-10