บทความนี้เป็นการใช้ ESP32 เพิ่อทำการหมุนสี่เหลี่ยมด้วยการใช้ไลบรารี ulab และนำผลจากการคำนวณไปแสดงผลที่โมดูลแอลซีดีกราฟิกที่ใช้หน่วยควบคุมเป็น ST7735s ดังที่เคยได้เขียนบทความไปแล้ว ซึ่งตัวอย่างของโปรแกรมประกอบด้วยการหมุนสี่เหลี่ยม 1 ชิ้นตามเข็มนาฬิกา และการหมุนสี่เหลี่ยมหลายชิ้นในทิศตรงกันข้ามกัน
อุปกรณ์
อุปกรณ์ประกอบการทดลอง คือ
ตัวอย่างโปรแกรม
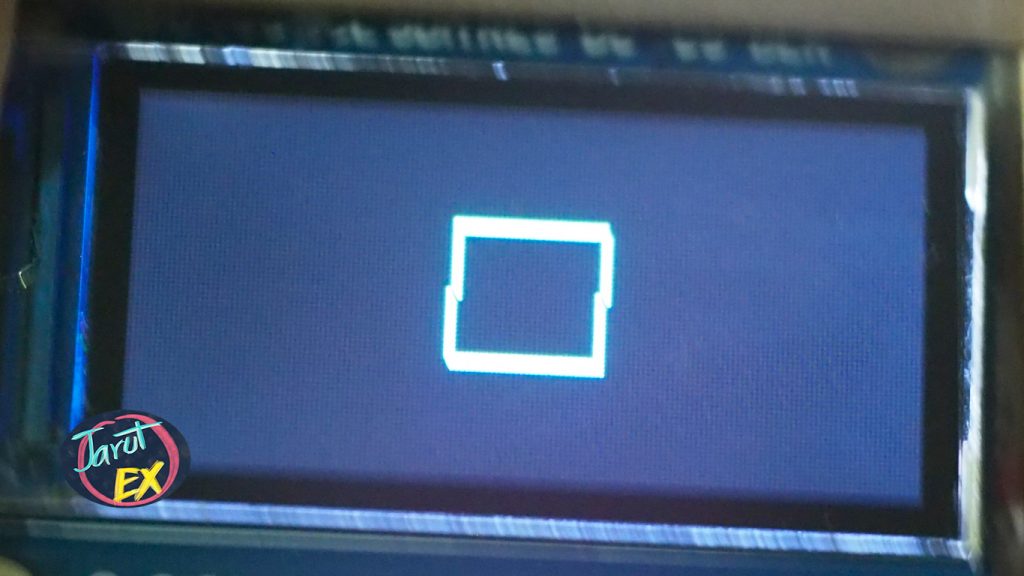
ตัวอย่างโปรแกรม code18-9 เป็นการหมุนสี่เหลี่ยมจากมุม 0 ถึง 359 ด้วยการวาดเส้นจากจุดยอด 4 จุด และคำนวณการหมุนด้วยไลบรารีของ ulab (อ่านบทความที่นี่) โดยผลลัพธ์ที่ได้เป็นดังภาพที่ 1
# code18-9
from st7735 import TFT
from machine import SPI,Pin
import machine as mc
import time
import math
import ulab as np

minX = -10.0
maxX = 10.0
minY = -5.0
maxY = 5.0
scrWidth = const(160)
scrHeight = const(80)
ratioX = float(scrWidth)/(math.fabs(minX)+math.fabs(maxX)+1)
ratioY = float(scrHeight)/(math.fabs(minY)+math.fabs(maxY)+1)
centerX = const(scrWidth >> 1)
centerY = const(scrHeight >> 1)

spi = SPI(1, baudrate=20000000,
          sck=Pin(14), mosi=Pin(13),
          polarity=0, phase=0)
# dc, rst, cs
tft=TFT(spi,2,None,15)
tft.init_7735(tft.GREENTAB80x160)


def rotate(pX,pY,angle):
    rad = math.radians(angle)
    xCos = pX*np.vector.cos(rad)
    ySin = pY*np.vector.sin(rad)
    xSin = pX*np.vector.sin(rad)
    yCos = pY*np.vector.cos(rad)
    newX = xCos - ySin
    newY = xSin + yCos
    return (newX, newY)

def draw(pX, pY,aColor=tft.WHITE):
    newPx = np.array(pX*ratioX+centerX,dtype=np.uint16)
    newPy = np.array(pY*ratioY+centerY,dtype=np.uint16)
    tft.line((newPx[0],newPy[0]),(newPx[1],newPy[1]),aColor)
    tft.line((newPx[1],newPy[1]),(newPx[2],newPy[2]),aColor)
    tft.line((newPx[2],newPy[2]),(newPx[3],newPy[3]),aColor)
    tft.line((newPx[3],newPy[3]),(newPx[0],newPy[0]),aColor)

# main program
tft.rotation(1)
tft.fill(tft.BLACK)

t0 = time.ticks_us()
pX = np.array([-2,2,2,-2],dtype=np.float)
pY = np.array([2,2,-2,-2],dtype=np.float)
for degree in range(360):
    newP = rotate(pX,pY,degree)
    draw(newP[0],newP[1],tft.WHITE)
    time.sleep_ms(100)
    tft.fill(0)
for degree in range(360):
    newP = rotate(pX,pY,-degree)
    draw(newP[0],newP[1],tft.CYAN)
    time.sleep_ms(100)
    tft.fill(0)
print("ulab: Delta = {} usec".format(time.ticks_us()-t0))

# endof program
time.sleep_ms(2000)
tft.on(False)
spi.deinit()
ตัวอย่างโปรแกรม code18-10 เป็นการเพิ่มสี่เหลี่ยมอีก 3 ชิ้น โดยมาจากการคำนวณด้วยการขยายวัตถุจากสี่เหลี่ยมรูปแรก และสั่งวาดให้หมุนกลับทิศกัน พร้อมแต่ละชิ้นหมุนตรงข้ามสลับกันไป ตัวอย่างผลลัพธ์เป็นดังภาพที่ 2
# code18-10
from st7735 import TFT
from machine import SPI,Pin
import machine as mc
import time
import math
import ulab as np

minX = -10.0
maxX = 10.0
minY = -5.0
maxY = 5.0
scrWidth = const(160)
scrHeight = const(80)
ratioX = float(scrWidth)/(math.fabs(minX)+math.fabs(maxX)+1)
ratioY = float(scrHeight)/(math.fabs(minY)+math.fabs(maxY)+1)
centerX = const(scrWidth >> 1)
centerY = const(scrHeight >> 1)

spi = SPI(1, baudrate=20000000,
          sck=Pin(14), mosi=Pin(13),
          polarity=0, phase=0)
# dc, rst, cs
tft=TFT(spi,2,None,15)
tft.init_7735(tft.GREENTAB80x160)

def rotate(pX,pY,angle):
    rad = math.radians(angle)
    xCos = pX*np.vector.cos(rad)
    ySin = pY*np.vector.sin(rad)
    xSin = pX*np.vector.sin(rad)
    yCos = pY*np.vector.cos(rad)
    newX = xCos - ySin
    newY = xSin + yCos
    return (newX, newY)

def scale(pX,pY,Sx=1.0,Sy=1.0):
    return ((pX*Sx, pY*Sy))

def draw(pX, pY,aColor=tft.WHITE):
    newPx = np.array(pX*ratioX+centerX,dtype=np.uint16)
    newPy = np.array(pY*ratioY+centerY,dtype=np.uint16)
    tft.line((newPx[0],newPy[0]),(newPx[1],newPy[1]),aColor)
    tft.line((newPx[1],newPy[1]),(newPx[2],newPy[2]),aColor)
    tft.line((newPx[2],newPy[2]),(newPx[3],newPy[3]),aColor)
    tft.line((newPx[3],newPy[3]),(newPx[0],newPy[0]),aColor)

# main program
tft.rotation(1)
tft.fill(tft.BLACK)

t0 = time.ticks_us()
pX = np.array([-0.5,0.5,0.5,-0.5],dtype=np.float)
pY = np.array([0.5,0.5,-0.5,-0.5],dtype=np.float)
p2 = scale(pX,pY,2.2,2.2)
p3 = scale(pX,pY,3.8,3.8)
p4 = scale(pX,pY,5.4,5.4)
for degree in range(0,361,4):
    tft.fill(0)
    newP = rotate(pX,pY,degree)
    newP2 = rotate(p2[0],p2[1],-degree)
    newP3 = rotate(p3[0],p3[1], degree)
    newP4 = rotate(p4[0],p4[1], -degree)
    draw(newP[0],newP[1],tft.WHITE)
    draw(newP2[0],newP2[1],tft.GREEN)
    draw(newP3[0],newP3[1],tft.CYAN)
    draw(newP4[0],newP4[1],tft.YELLOW)
for degree in range(0,361,8):
    tft.fill(0)
    newP = rotate(pX,pY,-degree)
    newP2 = rotate(p2[0],p2[1],degree)
    newP3 = rotate(p3[0],p3[1],-degree)
    newP4 = rotate(p4[0],p4[1],degree)
    draw(newP[0],newP[1],tft.WHITE)
    draw(newP2[0],newP2[1],tft.GREEN)
    draw(newP3[0],newP3[1],tft.CYAN)
    draw(newP4[0],newP4[1],tft.YELLOW)
print("ulab: Delta = {} usec".format(time.ticks_us()-t0))

# endof program
time.sleep_ms(2000)
tft.on(False)
spi.deinit()

สรุป
จากตัวอย่างในบทนี้จะพบว่า การทำงานของ ulab ทำให้สามารถประมวลผลเวกเตอร์หรือแถวลำดับของพิกัดในแกน x และ y ได้หลายชุดในคำสั่งเดียว แต่ความเร็วที่สูญเสียไปกลับไปตกในเรื่องของความเร็วในการแสดงผล แต่อย่างไรก็ดี ผู้เขียนหวังว่าบทความนี้คงเป็นตัวอย่างและแนวทางสำหรับผู้ที่สนใจใช้ภาษาไพธอนในการคำนวณค่าทางคณิตศาสตร์เพื่อนำไปประยุกต์ใช้ในการแสดงผล หรือด้าน AI ต่อไป
สุดท้ายนี้ขอให้สนุกกับการเขียนโปรแกรมครับ
(C) 2020, โดย อ.ดนัย เจษฎาฐิติกุล/อ.จารุต บุศราทิจ
ปรับปรุงเมื่อ 2020-11-10
ปรับปรุงเมื่อ 2021-08-14
ปรับปรุงเมื่อ 2021-08-17