This article is an application of Python’s list data structure to store the frequency count of random numbers which is useful for further statistical use. This article relies on knowledge of random numbers and using list type variables tested with Micropython on esp8266 and esp32 microcontrollers.
Problem
How to create a frequency table of 100 random numbers using the range 0 to 20?
Problem solving idea
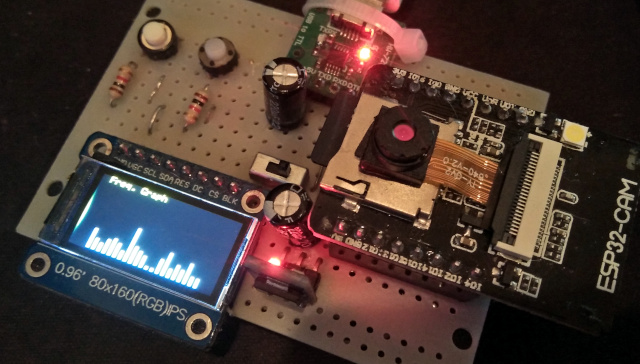
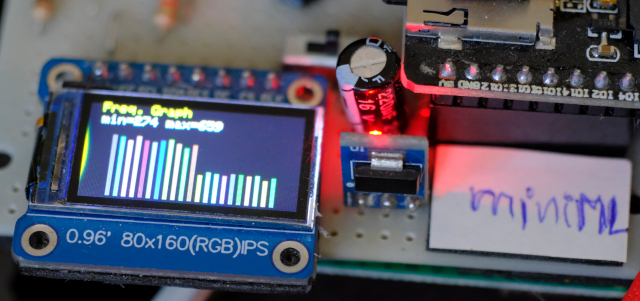
In this experiment, our team uses dCore-miniML (Figure 1) which is an expansion board of ESP32-CAM and ESP8266 that is connected to ET-BASE NodeMCU to test the operation.
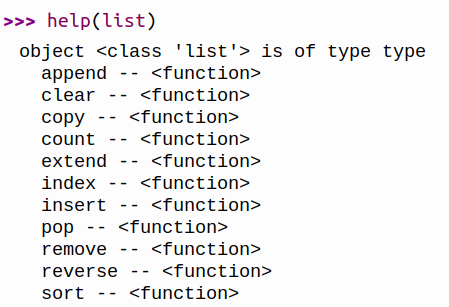
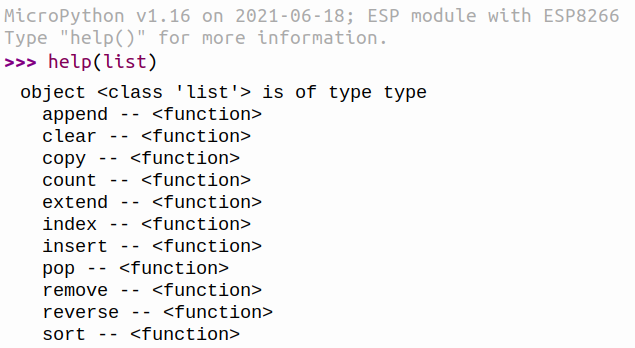
First of all, have to look at the properties of the class list that Micropython of esp32 supports as shown in Figure 2 and of esp8266 as shown in Figure 3. Both support the same functionality which makes programming more convenient.
Creating a list-type object can be done in several ways but what we like to use is as follows.
obj = []
From Figures 2 and 3, the functions of the command can be summarized as follows:
- append( data ) Add data to the list.
- clear( ) Clears all stored values.
- copy( ) Copy a list to another set of data.
- count( ) Count the number of members in the list
- extend( list ) Append a given list to the end
- index( data ) Find the order of ‘data’ in a list.
- insert( index, data ) Inserts ‘data’ into the specified ‘order’.
- pop( ) Remove the information at the end of the list and return the value.
- remove( data ) Remove the desired list. If multiple data sets are found, the first one will be deleted.
- reverse() Reverse the order of data within a list.
- sort( reverse=False ) Sort items in a list. If you want to sort in descending order, specify reverse=True.
Example Code
Coding style 1
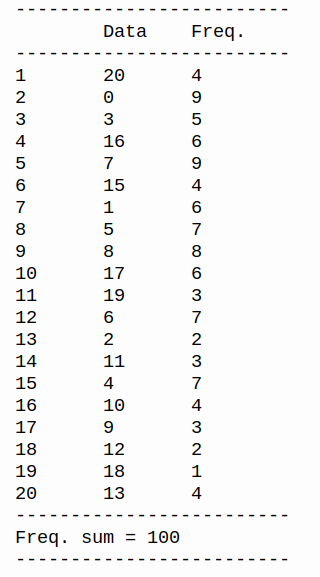
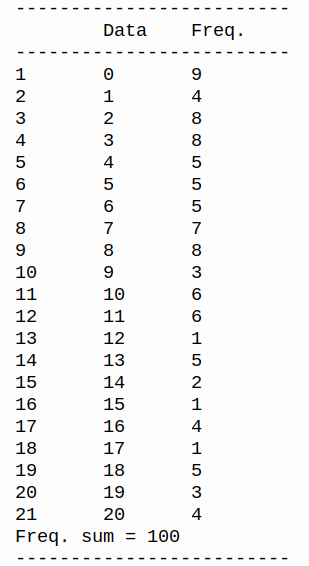
The first example uses two list objects named data and freq to store data and amount of data by randomly using getrandbits(5)%21 means a 5-bit random value 0 to 31, but only 0 to 20 is needed, so divide % by 21 to get a value in the range 0 to 20. Increase the frequency by 1, if not found, it will add a list of data to the data and increase the frequency by 1 in the freq. After 100 randomizations, it enters the last part of the program, which is to display the stored data. The working result example is shown in Figure 4.
# randomize 100 sets using numbers 0-20 and count the frequency.
import random

data = []
freq = []
for i in range(100):
    item = random.getrandbits(5)%21
    if (len(data) == 0):
        data.append(item) #Collect random numbers
        freq.append(1) # store the frequency
    else:
        if (item in data):
            idx = data.index(item)
            freq[idx] += 1
        else:
            data.append(item) # Collect random numbers
            freq.append(1) # store the frequency
print("-------------------------")
print("\tData\tFreq.")
print("-------------------------")
sum = 0
for i in range(len(data)):
    print("{}\t{}\t{}".format(i+1,data[i],freq[i]))
    sum += freq[i]
print("-------------------------")
print("Freq. sum = {}".format(sum))
print("-------------------------")
Coding style 2
From the first example, the arrangement of the data in the list is not good, so the frequency table has been adjusted to look good in ascending order by using the principle of generating random numbers and collecting 100 sets of data, then rearranging the data to make the random data in ascending order.
Once the data is sorted in ascending order, create a random table in freqTable by considering the value of data one by one. If it is a new value, add that data to freqTable and set the frequency value to 1 with [value, 1] into the list. But if it is found that duplicates the previous one stored in freqTable, it will increase the frequency of that data. Finally, show the data as in the example in Figure 5.
# randomize 100 sets using numbers 0-20 and count the frequency.
import random

data = []
freqTable = []
# random 100 items
for i in range(100):
    data.append(random.getrandbits(5)%21)
# processing
data.sort()
freqTableIdx = 0
for i in range(100):
    if (i == 0): # first time
        freqTable.append([data[i],1])
    else:
        if (freqTable[freqTableIdx][0] == data[i]):
            freqTable[freqTableIdx][1] += 1
        else:
            freqTable.append([data[i],1])
            freqTableIdx += 1
print("-------------------------")
print("\tData\tFreq.")
print("-------------------------")
sum = 0
for i in range(len(freqTable)):
    print("{}\t{}\t{}".format(i+1, freqTable[i][0],freqTable[i][1]))
    sum += freqTable[i][1]
print("Freq. sum = {}".format(sum))
print("-------------------------")
Coding style 3
When using coding style 2 to add part of the graph display on the TFT screen as shown in Figure 1, the program code will be as follows.
# randomize 100 sets using numbers 0-20 and count the frequency.
import random
from st7735 import TFT
from sysfont import sysfont
from machine import SPI,Pin
import machine as mc
import time
import math

data = []
freqTable = []
# random 100 items
for i in range(100):
    data.append(random.getrandbits(5)%21)
# processing
data.sort()
freqTableIdx = 0
for i in range(100):
    if (i == 0): # first time
        freqTable.append([data[i],1])
    else:
        if (freqTable[freqTableIdx][0] == data[i]):
            freqTable[freqTableIdx][1] += 1
        else:
            freqTable.append([data[i],1])
            freqTableIdx += 1

print("-------------------------")
print("\tData\tFreq.")
print("-------------------------")
sum = 0
for i in range(len(freqTable)):
    print("{}\t{}\t{}".format(i+1, freqTable[i][0],freqTable[i][1]))
    sum += freqTable[i][1]
print("Freq. sum = {}".format(sum))
print("-------------------------")

mc.freq(240000000)
spi = SPI(2, baudrate=27000000,
          sck=Pin(14), mosi=Pin(12),
          polarity=0, phase=0)
# dc, rst, cs
tft=TFT(spi,15,13,2)
tft.init_7735(tft.GREENTAB80x160)

tft.fill(tft.BLACK)
tft.text((10,0),"Freq. Graph",tft.YELLOW, sysfont)
for i in range(len(freqTable)):
    tft.fillrect((20+i*6,78-freqTable[i][1]*3),(3,freqTable[i][1]*3),tft.WHITE)
Coding style 4
In this method, the issue of finding the min and max intervals is added to be used to calculate the proportion of the height adjustment of the graph using the following equation:
scale = math.fabs(maxY-minY)
Then calculate the height of the graph, which is the frequency value, with the following equation:
data = int(height*(freq/scale))
In addition, it has been adjusted to have a random color value for each bar graph. The whole program code when combined is as follows. An example of the result is shown in Figure 6.
import random
from st7735 import TFT
from sysfont import sysfont
from machine import SPI,Pin
import machine as mc
import time
import math

maxData = const(10000)
data = []
freqTable = []
graphHeight = const(30)
minY = maxData
maxY = 1

mc.freq(240000000)
spi = SPI(2, baudrate=30000000,
          sck=Pin(14), mosi=Pin(12),
          polarity=0, phase=0)
# dc, rst, cs
tft=TFT(spi,15,13,2)
tft.init_7735(tft.GREENTAB80x160)

tft.fill(tft.BLACK)
tft.text((10,36),"(C)2020-21",tft.YELLOW,sysfont)
tft.text((92,36),"JarutEx",tft.WHITE,sysfont)
tft.text((93,36),"JarutEx",tft.WHITE,sysfont)


time.sleep_ms(1000)
tft.fill(tft.BLACK)
tft.text((10,0), "Freq. Graph",tft.YELLOW,sysfont)

# random 100 items
for i in range(maxData):
    data.append(random.getrandbits(5)%21)
# processing
data.sort()
freqTableIdx = 0
for i in range(maxData):
    if (i == 0): # first time
        freqTable.append([data[i],1])
    else:
        if (freqTable[freqTableIdx][0] == data[i]):
            freqTable[freqTableIdx][1] += 1
        else:
            freqTable.append([data[i],1])
            freqTableIdx += 1

print("-------------------------")
print("\tData\tFreq.")
print("-------------------------")
sum = 0
for i in range(len(freqTable)):
    print("{}\t{}\t{}".format(i+1, freqTable[i][0],freqTable[i][1]))
    if minY > freqTable[i][1]:
        minY = freqTable[i][1]
    if maxY < freqTable[i][1]:
        maxY = freqTable[i][1]
    sum += freqTable[i][1]

print("Freq. sum = {}".format(sum))
print("-------------------------")

tft.text((10,10),"min={} max={}".format(minY,maxY),tft.WHITE,sysfont)
scale = math.fabs(maxY-minY) # find the length of range
#print("Scale = {} [{}-{}]".format(scale,minY,maxY))
for i in range(len(freqTable)):
    data = int(graphHeight*(freqTable[i][1]/scale))
    gColor = tft.color(random.getrandbits(8),random.getrandbits(8),random.getrandbits(8))
    tft.fillrect((20+i*6,78-data),(3,data),gColor)
Conclusion
Solving the problem of creating a frequency table with a list structure or using a class list can be written in a variety of ways depending on the way of thinking and skill of the programmer. The more different ways they can write, the more skilled the programmer is. But one thing that won’t get from the frequency count is how much of the data happens in order. The data acquisition time characteristics may be necessary for the use of data in some cases, therefore, periodic data collection is necessary. And the creation of a frequency table of the data should be based on the raw data processing. Finally, have fun with programming.
If you want to talk with us, feel free to leave comments below!!
(C) 2020-2021, By Jarut Busarathid and Danai Jedsadathitikul
Updated 2021-11-27