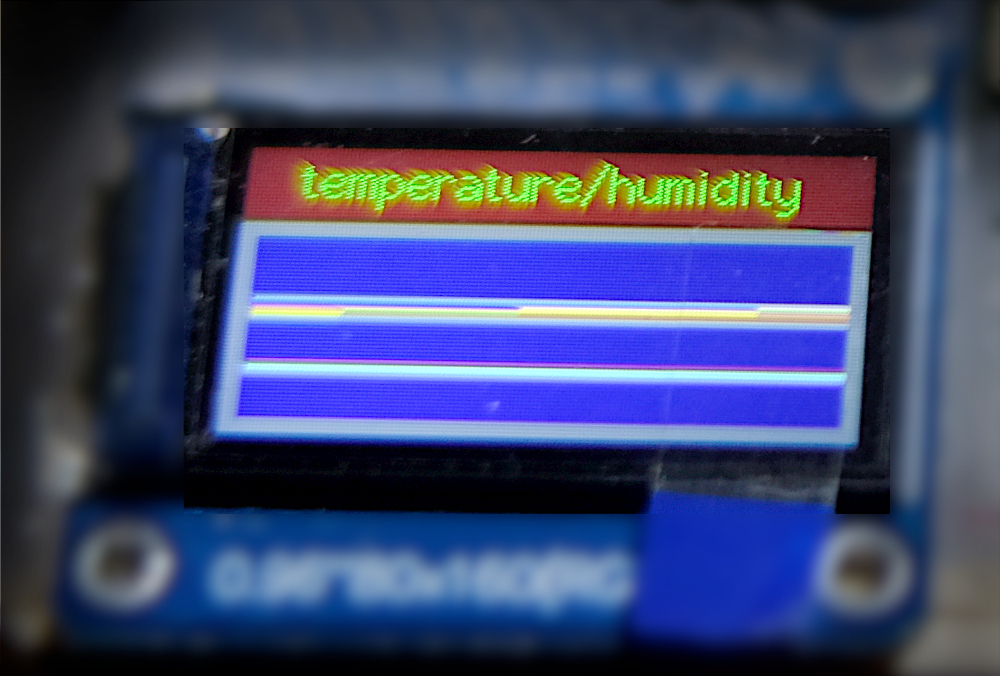
From the article Singly Linked List Data Structures, the use of the DHT11 sensor module with the STM32F103 microcontroller, and the use of the TFT display module based on the st7735s controller, the idea of this article is to take an example of using a singly linked list data structure to collect the temperature and humidity values to find the maximum, minimum, average, together with the data in the list to display in the form of a graph as shown in Figure 1.
Equipment
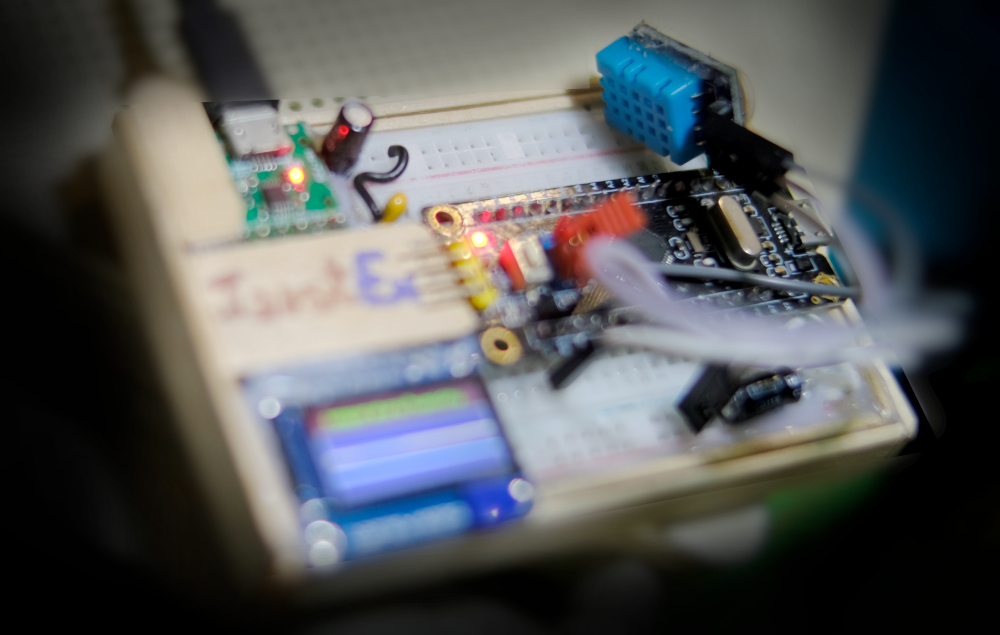
The list of equipment used is shown in Figure 2.
- STM32F103
- DHT11 module
- st7735s TFT display
- DHT11 library
- TFT_eSPI library
Example program
The connection of the DHT11 module to the STM32F103 is as follows.
- DHT11 pin + conncet to 3V3
- DHT11 pin – connect to GND
- pin S of DHT11 connect to PB13
The pin of the TFT connected to the STM32F103 SPI bus is as written in the article st7735s. The working principle of the program code is as follows.
- Initialize the TFT module.
- Initialize the DHT11 module.
- Draw the background of the program on the display.
- in th loop
- Add up to 10 nodes to the link list. The data in the node contains the values obtained from the DHT11 module, the degree Celsius temperature and the humidity value (addNode function).
- Find the minimum, maximum and mean values. (refer to findAverage function)
- draw the graph
- Adjust the minimum, maximum, and average temperature and humidity (map) values to be in the range of 75 to 25 for display purposes.
- Draw a linear graph of the values in item 1 above.
- Loop to draw a linear graph of temperature and humidity values from the link list.
- Delays 15 seconds
Code
#include <SPI.h>
#include <TFT_eSPI.h>
#include <DHT.h>

TFT_eSPI tft = TFT_eSPI();
DHT dht = DHT(PB13, DHT11);

struct sNode {
  float t;
  float h;
  sNode * next;
};

sNode *rootNode = NULL;
sNode *currentNode = NULL;
sNode *newNode = NULL;
int countNode = 0;
float tAvg = 0.0;
float hAvg = 0.0;
float tMax = 0.0;
float tMin = 101.0;
float hMax = 0.0;
float hMin = 101.0;

void addNode() {
  if (countNode == 10) {
    delete1stNode();
    countNode--;
  }
  newNode = (sNode*)malloc(sizeof(sNode));
  if (newNode) {
    newNode->t = dht.readTemperature();
    newNode->h = dht.readHumidity();
    if (tMin > newNode->t) {
      tMin = newNode->t;
    }
    if (tMax < newNode->t) {
      tMax = newNode->t;
    }
    if (hMin > newNode->h) {
      hMin = newNode->h;
    }
    if (hMax < newNode->h) {
      hMax = newNode->h;
    }
    newNode->next = NULL;
    if (rootNode == NULL) {
      rootNode = newNode;
      currentNode = newNode;
    } else {
      currentNode->next = newNode;
      currentNode = newNode;
    }
    countNode++;
  } else {
    tft.fillScreen( TFT_RED );
    tft.setTextColor( TFT_YELLOW );
    tft.drawString( "ERROR", 40, 8, 4);
    tft.setTextColor( TFT_WHITE );
    tft.drawString("Not enough memory!", 4, 44, 2);
    while (1) {
    }
  }
}

void delete1stNode() {
  newNode = rootNode;
  rootNode = newNode->next;
  free(newNode);
}

void findAverage() {
  float tSum = 0.0;
  float hSum = 0.0;
  sNode * p;
  p = rootNode;
  for (int idx = 0; idx < countNode; idx++) {
    tSum += p->t;
    hSum += p->h;
    p = p->next;
  }
  tAvg = tSum / (float)countNode;
  hAvg = hSum / (float)countNode;
}

void drawScreen() {
  int newTemMin, newTemMax;
  int newHumMin, newHumMax;
  int newTem;
  int newHum;
  int newTemAvg, newHumAvg;
  sNode * p;
  p = rootNode;

  tft.fillRect(4, 25, 152, 51, TFT_NAVY);
  // scale
  newTemMin = map((int)tMin, 0, 100, 75, 25);
  newTemMax = map((int)tMax, 0, 100, 75, 25);
  newHumMin = map((int)hMin, 0, 100, 75, 25);
  newHumMax = map((int)hMax, 0, 100, 75, 25);
  newTemAvg = map((int)tAvg, 0, 100, 75, 25);
  newHumAvg = map((int)hAvg, 0, 100, 75, 25);
  // draw
  tft.drawLine(5, newTemMin, 155, newTemMin, TFT_LIGHTGREY);
  tft.drawLine(5, newTemMax, 155, newTemMax, TFT_BROWN);
  tft.drawLine(5, newHumMin, 155, newHumMin, TFT_SILVER);
  tft.drawLine(5, newHumMax, 155, newHumMax, TFT_SKYBLUE);
  tft.drawLine(5, newTemAvg, 155, newTemAvg, TFT_GOLD);
  tft.drawLine(5, newHumAvg, 155, newHumAvg, TFT_ORANGE);
  //
  int oldTem, oldHum;
  int xStep = 15;
  int xStart = 5;
  for (int idx = 0; idx < countNode; idx++) {
    newTem = map((int)p->t, 0, 100, 75, 25);
    newHum = map((int)p->h, 0, 100, 75, 25);
    if (idx == 0) {
      tft.drawLine(xStart + idx * xStep, newTem, xStart + (idx + 1)*xStep, newTem, TFT_CYAN);
      tft.drawLine(xStart + idx * xStep, newHum, xStart + (idx + 1)*xStep, newHum, TFT_YELLOW);
    } else {
      tft.drawLine(xStart + idx * xStep, oldTem, xStart + (idx + 1)*xStep, newTem, TFT_CYAN);
      tft.drawLine(xStart + idx * xStep, oldHum, xStart + (idx + 1)*xStep, newHum, TFT_YELLOW);
    }
    oldTem = newTem;
    oldHum = newHum;
    p = p->next;
  }
}

void setup() {
  tft.init();
  dht.begin();

  tft.setRotation(1);
  tft.writecommand(ST7735_MADCTL);
  tft.writedata(TFT_MAD_MV | TFT_MAD_COLOR_ORDER );

  tft.fillScreen( TFT_BLACK );
  tft.setTextColor( TFT_GREEN );
  tft.fillRect(0, 0, 160, 20, TFT_MAROON);
  tft.drawString( "temperature/humidity", 14, 1, 2);
  tft.fillRect(0, 21, 160, 60, TFT_DARKGREY);
}

void loop() {
  addNode();
  findAverage();
  drawScreen();
  for (int i=0; i<15; i++) {
    delay(60000); // 1-minute
  }
}
Conclusion
From this article, it would be an example to show that applying data structures to real work is not difficult (If you have written a library or a function of that type of data structure) and can be applied in a variety of display applications, for example, in this article, we used a TFT display, but if you choose to use the ESP8266 or ESP32 microcontroller you can also change the display to draw graphs written in JavaScript to be displayed on the HTML5 canvas as well. Finally, have fun with programming.
(C) 2020-2022, By Jarut Busarathid and Danai Jedsadathitikul
Updated 2022-02-16